


Gene Interaction Network Visualization
Based on Graph Embedding Model
Yunchi Zhu, Yunqing Liu, Chunpeng He, Zuhong Lu
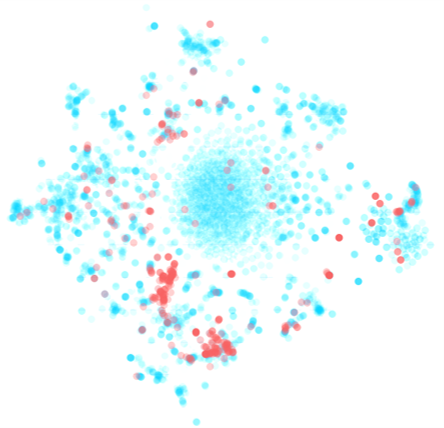
BENviewer is a brand-new online gene interaction network visualization server based on graph embedding models. With mature graph embedding algorithms applied on several interaction network databases, it provides human-friendly 2D visualization based on more than 2000 biological pathways, and these results present not only genes involved but also tightness of interactions in an intuitive way. As a unique visualization server introducing graph embedding application for the first time, it's expected to help researchers gain deeper insights into biological networks beyond generating results explainable by existing knowledge. Additionally, operation-flow for users is simplified to greater extent in its current version, meanwhile URL optimization contributes to data acquisition in batch for further analysis.The web server is open-sourced at https://github.com/SKLB-lab/BENviewer.